0x5f3759df (appendix)
This post is an appendix to my previous post about 0x5f3759df. It probably won’t make sense if you haven’t read that post (and if you’ve already had enough of 0x5f3759df you may consider skipping this one altogether).
One point that bugged me about the derivation in the previous post was that while it explained the underlying mathematics it wasn’t very intuitive. I was basically saying “it works because of, umm, math”. So in this post I’ll go over the most abstract part again (which was actually the core of the argument). This time I’ll explain the intuition behind what’s going on. And there’ll be some more graphs. Lots of them.
The thing is, there is a perfectly intuitive explanation for why this works. The key is looking more closely at the float-to-int bit-cast operation. Let’s take that function,
int float_to_int(float f) {
  return *(int*)&f;
}
and draw it as a graph:
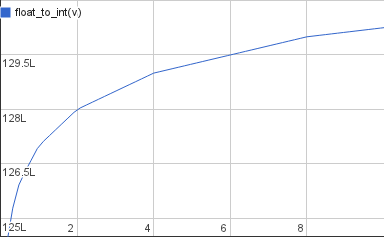
This is a graph of the floating-point numbers from around 1 to 10 bit-cast to integers. These are very large integers (L is 223 so 128L is 1 073 741 824). The function has visible breaks at powers of two and is a straight line inbetween. This makes sense intuitively if you look at how you decode a floating-point value:
\[v = (1+m)2^e\]The mantissa increases linearly from 0 to 1; those are the straight lines. Once the mantissa reaches 1 the exponent is bumped by 1 and the mantissa starts over from 0. Now it’ll be counting twice as fast since the increased exponent gives you another factor of 2 multiplied onto the value. So after a break the straight line covers twice as many numbers on the x axis as before.
Doubling the distance covered on the x axis every time you move a fixed amount on the y axis – that sounds an awful lot like log2. And if you plot float_to_int and log2 (scaled appropriately) together it’s clear that one is an approximation of the other.
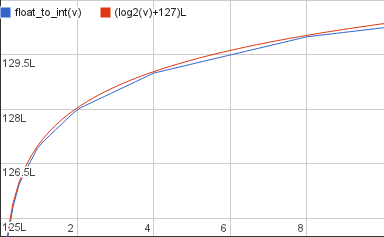
In other words we have that
\[\mathtt{float\_to\_int}(v) \approx (\log_2(v)+B)L\]This approximation is just a slightly different way to view the linear approximation we used in the previous post. You’ll notice that the log2 graph overshoots float_to_int in most places, they only touch at powers of 2. For better accuracy we’ll want to move it down a tiny bit – you’ll already be familiar with this adjustment: it’s σ. But I’ll leave σ out of the following since it’s not strictly required, it only improves accuracy.
You can infer the approximation formula from the above formula alone but I’ll do it slightly differently to make it easier to illustrate what’s going on.
The blue line in the graph above, float_to_int(v), is the i in the original code and the input to our calculation. We want to do integer arithmetic on that value such we get an output that is approximately
the integer value that, if converted back to a float, gives us roughly the inverse square root of x. First, let’s plot the input and the desired output in a graph together:
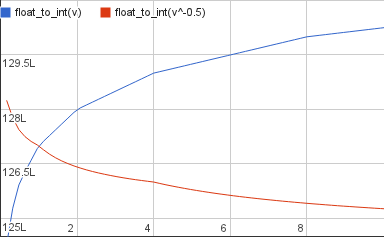
The desired output is decreasing because it’s a reciprocal so the larger the input gets the smaller the output. They intersect at v=1 because the inverse square root of 1 is 1.
The first thing we’ll do to the input is to multiply it by -1 to make it decrease too:
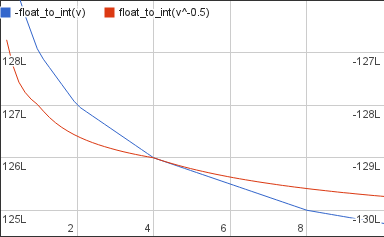
Where before we had a very large positive value we now have is a very large negative one. So even though they look like they intersect they’re actually very far apart and on different axes: the left one for the desired output, the right one for our work-in-progress approximation.
The new value is decreasing but it’s doing it at a faster rate than the desired output. Twice as fast in fact. To match the rates we multiply it by 1/2:
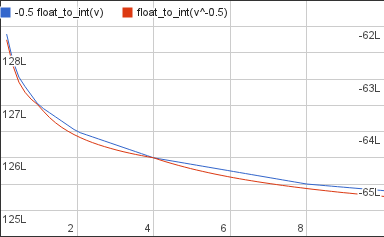
Now the two graphs are decreasing at the same rate but they’re still very far apart: the target is still a very large positive value and the current approximation is a half as large negative value. So as the last step we’ll add 1.5L B to the approximation, 0.5L B to cancel out the -1/2 we multiplied it with a moment ago and 1L B to bring it up to the level of the target:
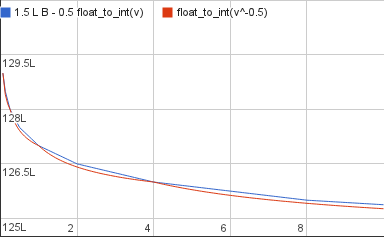
And there it is: a bit of simple arithmetic later and we now have a value that matches the desired output:
\[\mathtt{float\_to\_int}(v^{-\frac 12}) \approx \frac 32LB - \frac 12 \mathtt{float\_to\_int}(v)\]The concrete value of the constant is
\[\frac 32LB = \mathtt{0x5f400000}\]Again the approximation overshoots the target slightly the same way the log2 approximation did before. To improve accuracy you can subtract a small σ from B. That will give a slightly lower constant – for instance 0x5f3759df.
And with that I think it’s time to move onto something else. I promise that’s the last you’ll hear from me on the subject of that constant.