Monitoring
One really useful programming tool I use whenever it’s available is exported stats monitoring. It’s one of those things that has no standard definition and which people reimplement over and over in different ad-hoc ways. This post is about a monitoring tool for JavaScript programs running in chrome I implemented recently, WebMon.
WebMon
WebMon is a very simple tool conceptually; this image tells you all you need to know to use it:
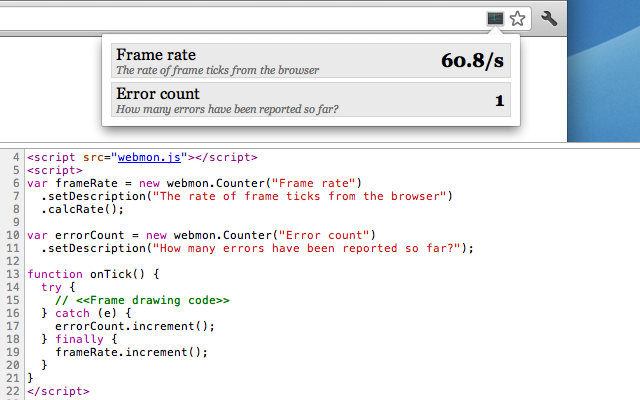
It has two parts: a JavaScript library, webmon.js, and a chrome extension, WebMon. In your JavaScript code you export a stat by creating an instance of the webmon.Counter type which is provided by the library. During execution you update the stats as appropriate using the methods on the Counter instances. The WebMon chrome extension detects any page that uses the library and can show you a popup that shows the current value of each exported stat, updated continuously. You can also specify some simple computations on the data, for instance here the frame rate counter is configured to display the rate per second rather than the count. To see this in action try installing the chrome extension and going to this test page. The extension needs pretty broad permissions to see stats on any web page so for the paranoid you may want to skim the source code before installing it.
The motivation for implementing this came from a WebGL-based hobby project I’m working on. I needed to keep track of the frame rate and rendering CPU load and my initial implementation which displayed those in a div on the page was just not working out. WebMon gives you the same functionality with a minimum of complexity and performance impact on the JavaScript side since almost all the code is in the chrome extension. It also doesn’t require you to clutter your page with debug info.
That’s all there is to it. The rest of this post will be about exported stats in general.
Monitoring
WebMon is just one example of the more general mechanism of exported stats. The general model is: a program exports a set of stats which it updates during execution. These stats are visible to some form of external processor/viewer which can record or at least see their value at any time. A simple example is chrome. If you run chrome with the --enable-stats-table command-line flag you can go to chrome://stats and see the current value of a number of chrome’s internal counters and timers. V8 has a similar mechanism but since v8 doesn’t have a UI that can easily display the stats I wrote a python script that continuously reads the counter values and displays them in a window. I used it all the time when working on the v8/chrome integration layer since it allowed me to see exactly how many dom node wrappers were live, exactly what had happened during the last garbage collection, etc.
Much of this you could also get by printing debug information and processing it either manually or, for more complex output, using separate programs. A place this works really well is dumping debug information after garbage collections in a virtual machine. Garbage collections happen rarely enough that it’s not a lot of overhead and you’re likely to want information about every collection, not just the last one. Compared to logging the advantage of using an exported stat is that updating it is cheaper – in the v8 implementation it’s just writing a single word in memory – and it scales well. If you log information about 100 different conditions your log becomes huge and difficult to process, and the I/O slows your program down. With exported stats the external processor or viewer can easily filter the stats for you and only show the ones you’re interested in. Also, the space for each export stat is constant, typically just a single word containing the stat and another few words of metainformation. Another advantage of exported stats is that they’re testable – you can easily read back and test the value of a counter whereas testing that the right thing is printed in a debug log is tricky.
Really I think each programming language should come with stats exporting and monitoring built in or as a canonical library. Or even better, since monitoring and viewing can (and should) be a separate process there could be a single common monitoring tool with a standard protocol that would have bindings for each language.
Until that happens, if you’d like to know what is happening in your JavaScript program as it happens you should give WebMon a try.